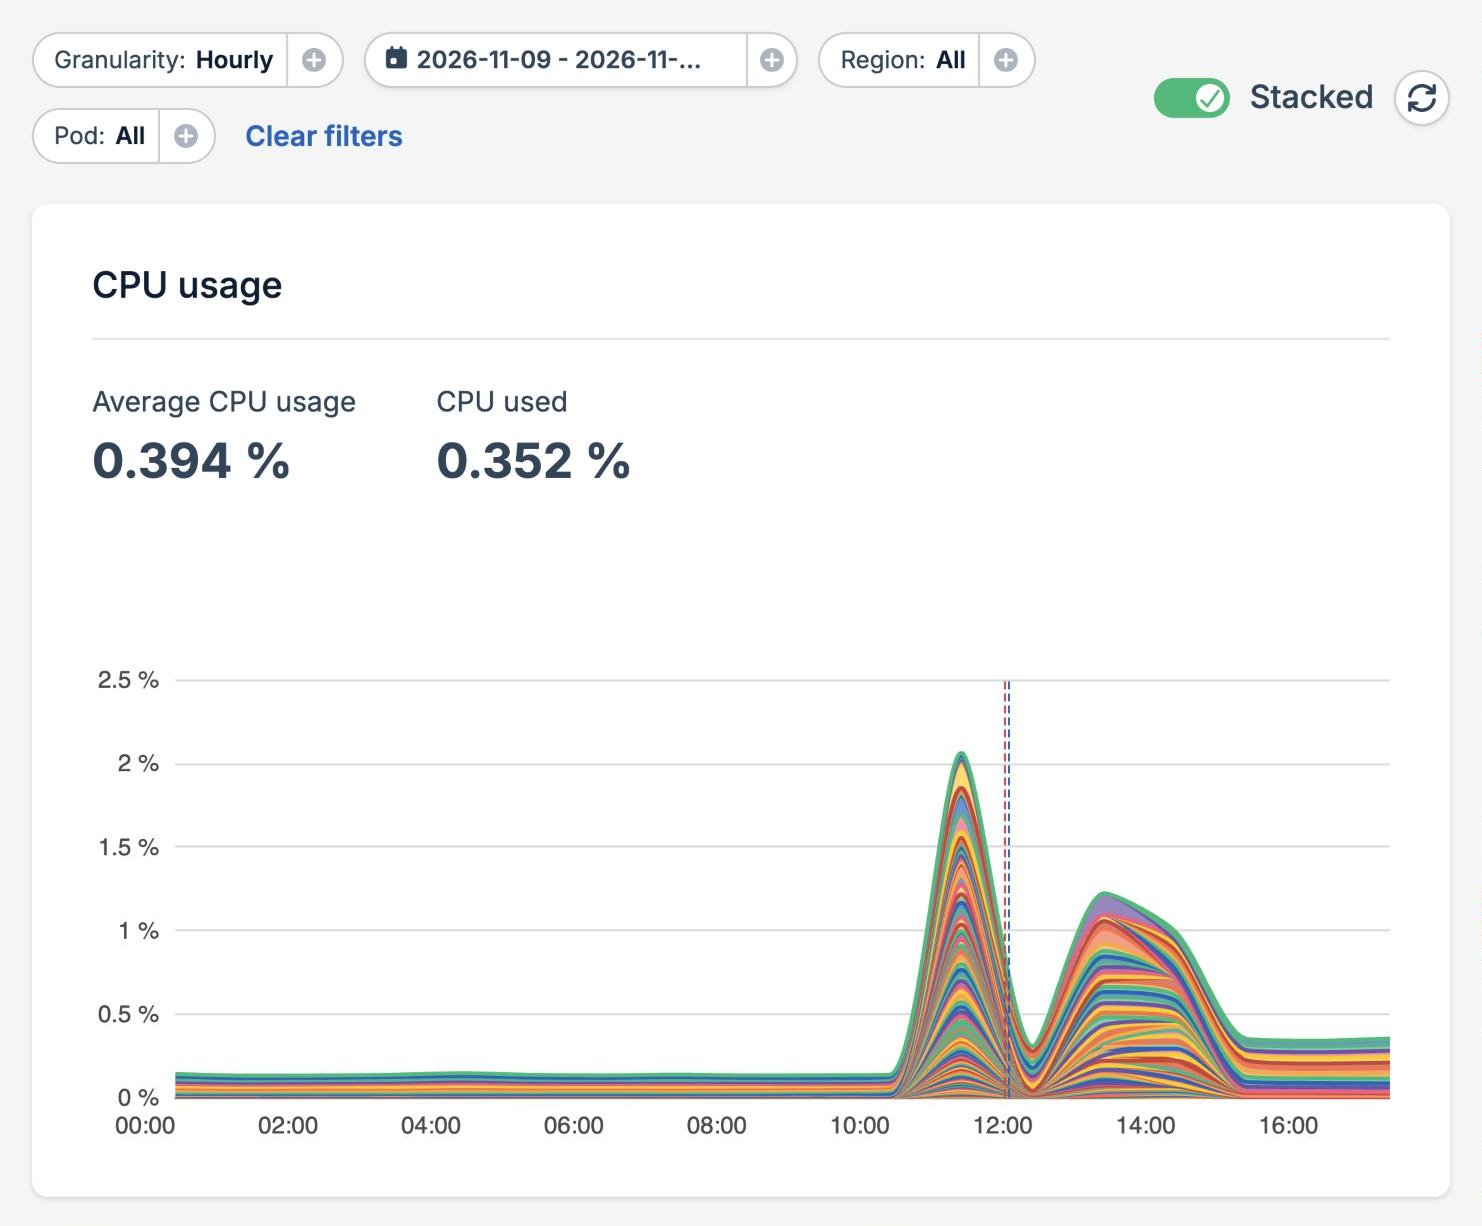
- Granularity shows one data point per hour or per day.
- Date range sets the days to show.
- Region and Pod narrow the charts to part of your application. See Filter by region and pod.
- Clear filters shows every region and pod again.
- Stacked switches between stacked and separate lines. See Stacked and separate lines.
- The refresh button loads the latest data.
Choose a time period
By default, the page shows yesterday and today with hourly data. Pick other days in the date range picker to look further back. The granularity follows the range you pick. A range of one or two days switches to Hourly, and a range longer than a week switches to Daily. Pick a granularity yourself to keep it whatever range you choose. Hourly data covers up to 7 days, so switching to Hourly on a longer range narrows it to the last 7 days. The selected period is part of the page URL, so you can bookmark it or share it with your team.Filter by region and pod
Use the Region filter to show only the pods that run in some of your regions. Narrowing the charts down to one region is a quick way to check whether a problem is limited to one location. Use the Pod filter to show only some pods. The list holds every pod that ran in the selected period and regions, including pods that were replaced since. Each pod is listed by the first 8 characters of its ID, and hovering over it shows the full ID.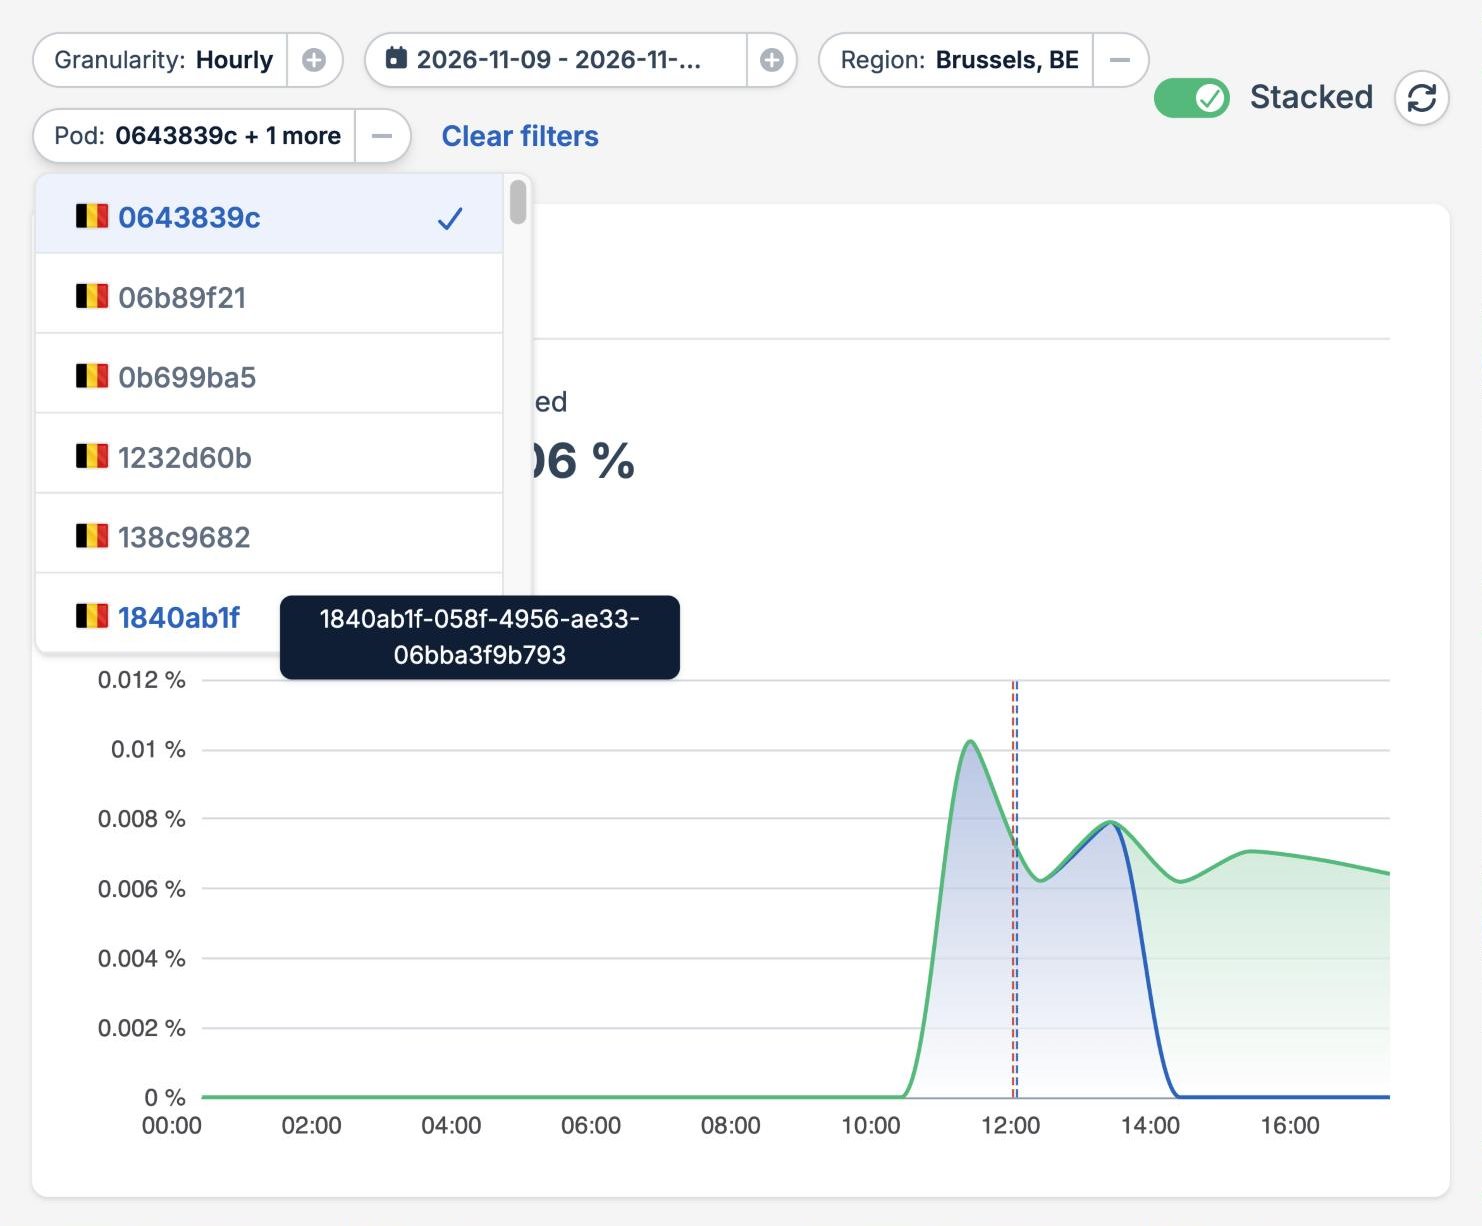
- CPU usage, Memory usage, Traffic served, and Ephemeral storage show the selected pods in the selected regions.
- Persistent volume shows the volumes in the selected regions. When you select pods, it shows the volumes those pods used.
- Instances & active regions follows the region filter only.
Stacked and separate lines
With Stacked on, the lines of the selected pods are stacked on top of each other, so the top edge of the chart is the total of your selection. The numbers above each chart describe that total. Turn Stacked off to draw each line on its own. Separate lines make it easier to compare pods and to spot a single pod that behaves differently from the rest. The numbers above each chart then describe an average pod. Hover over a chart to see the value of each line at that time. Pods that weren’t running at that time are left out of the list.Charts
A chart with nothing recorded for the selected period, regions, and pods shows No data instead of empty axes. For example, the Persistent volume chart stays empty for an application without persistent volumes.
Instances and regions
The Instances & active regions chart draws a line for each region, so you can see where your application ran at any time and how autoscaling changed the number of instances. With no region selected, it also draws the total number of instances of your application.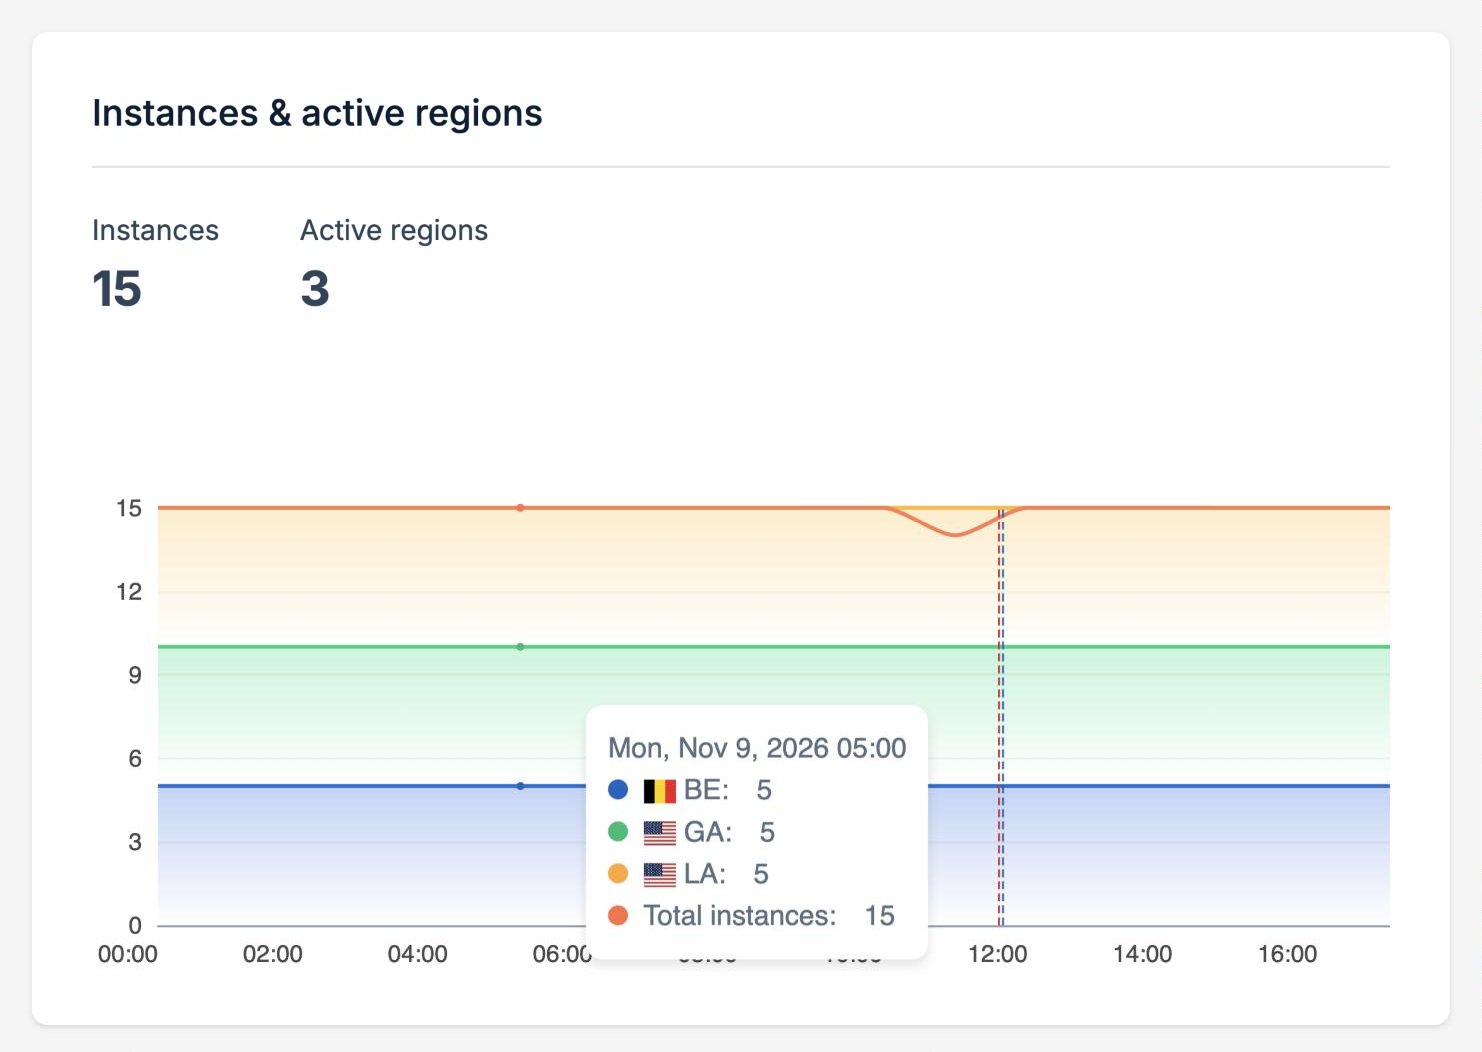
Release markers
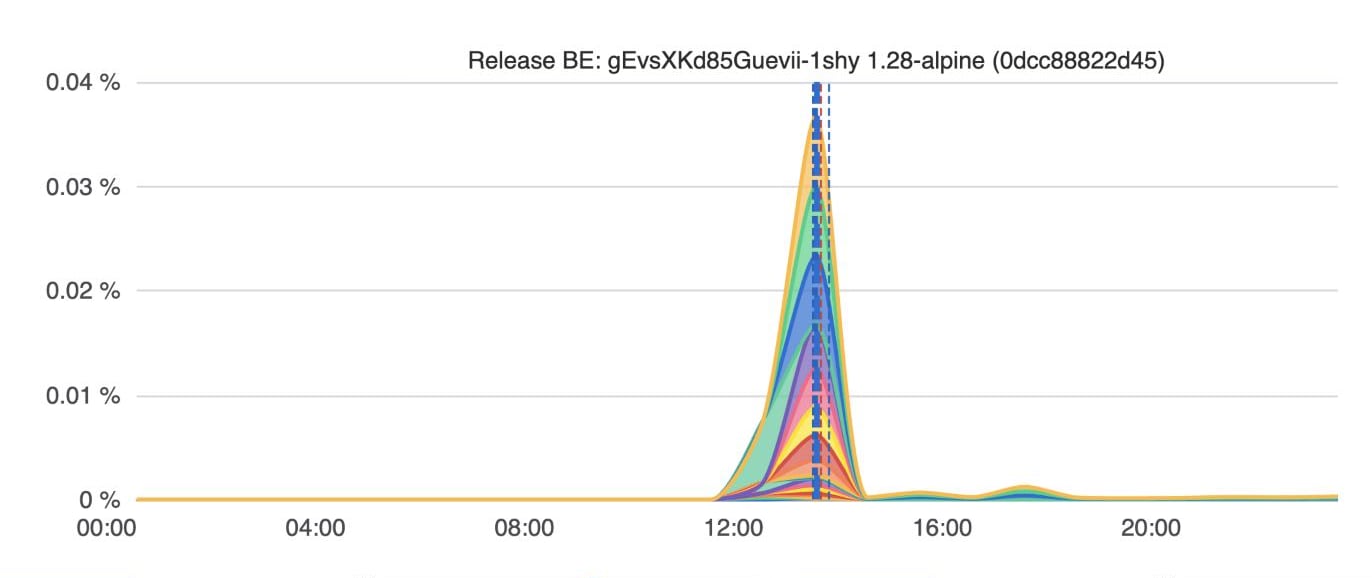
Each release of your application is marked on every chart with a dashed vertical line, one for each region it was rolled out to. A blue line marks a completed rolling update. A red line marks a release that was rolled back, for example because its new pods didn’t become healthy in time. Hover over a marker to see its region and the image tag and digest of each container it deployed.