

Filter the data
Every panel on the page uses the filters at the top:- Timeframe: The date range to show.
- Granularity: The size of each data point on the charts, such as hourly.
- Release: Show data for every release, or for a single deployment.
- Region: Show data for every region, or for a single region.
Requests and CPU time
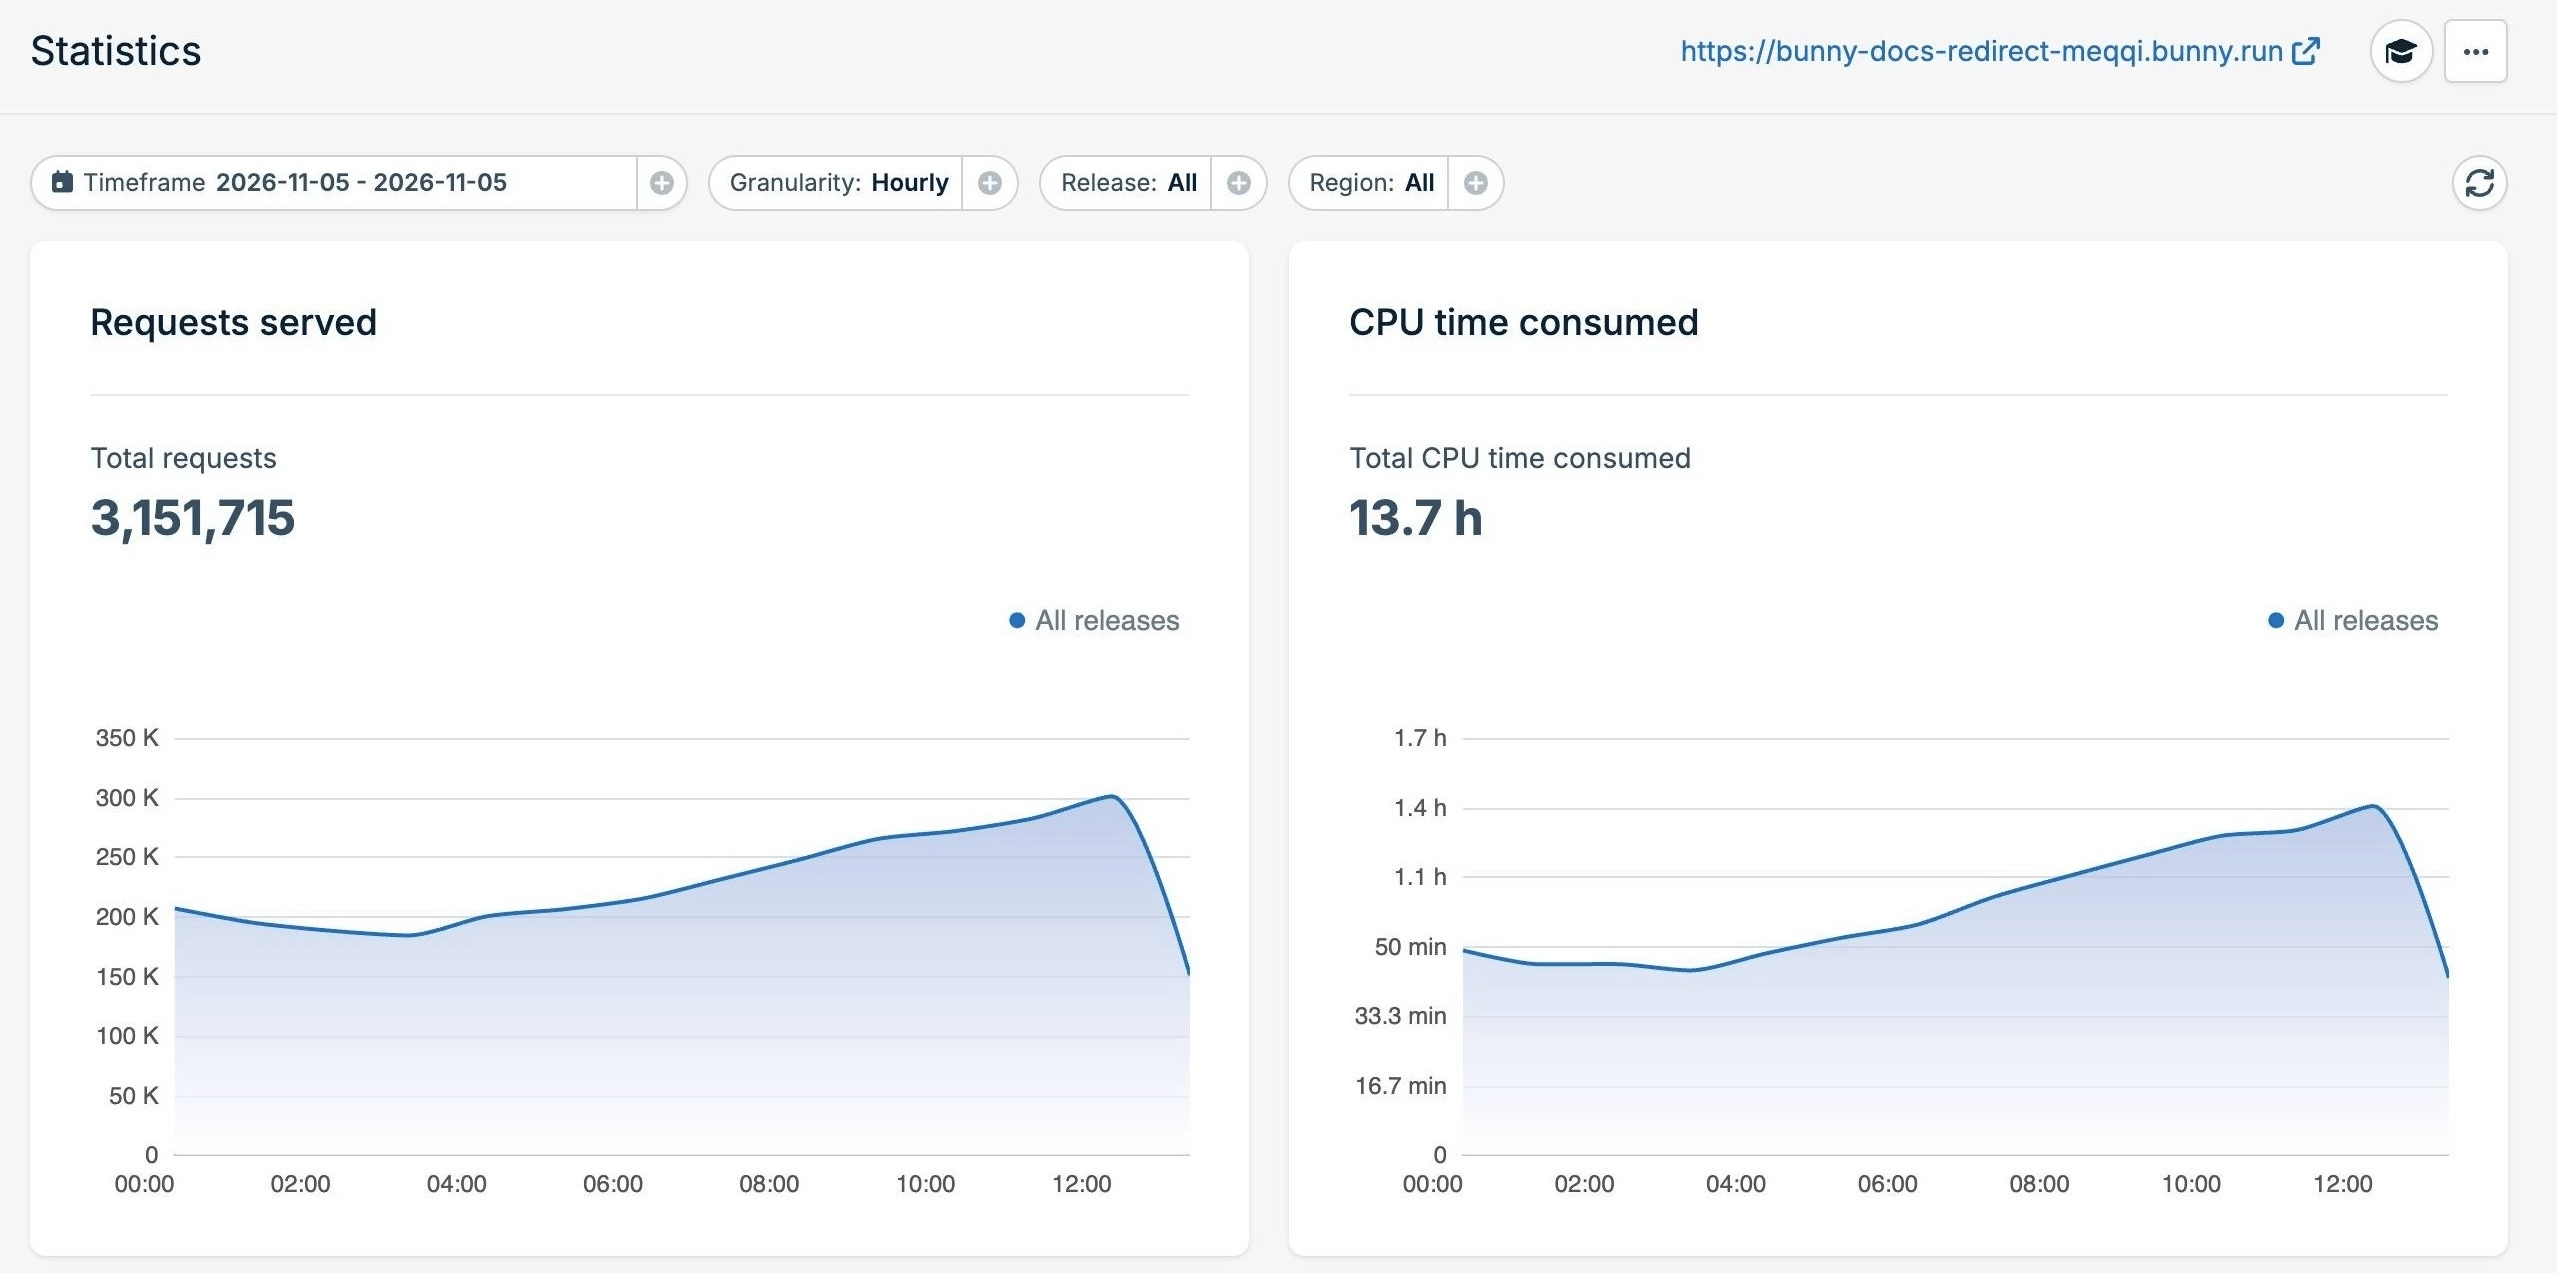
- Requests served: The total number of requests your script handled in the timeframe.
- CPU time consumed: The total CPU time your script used to run your code. Time spent waiting on network calls doesn’t count. CPU time is the basis for billing.
Wall time and memory usage
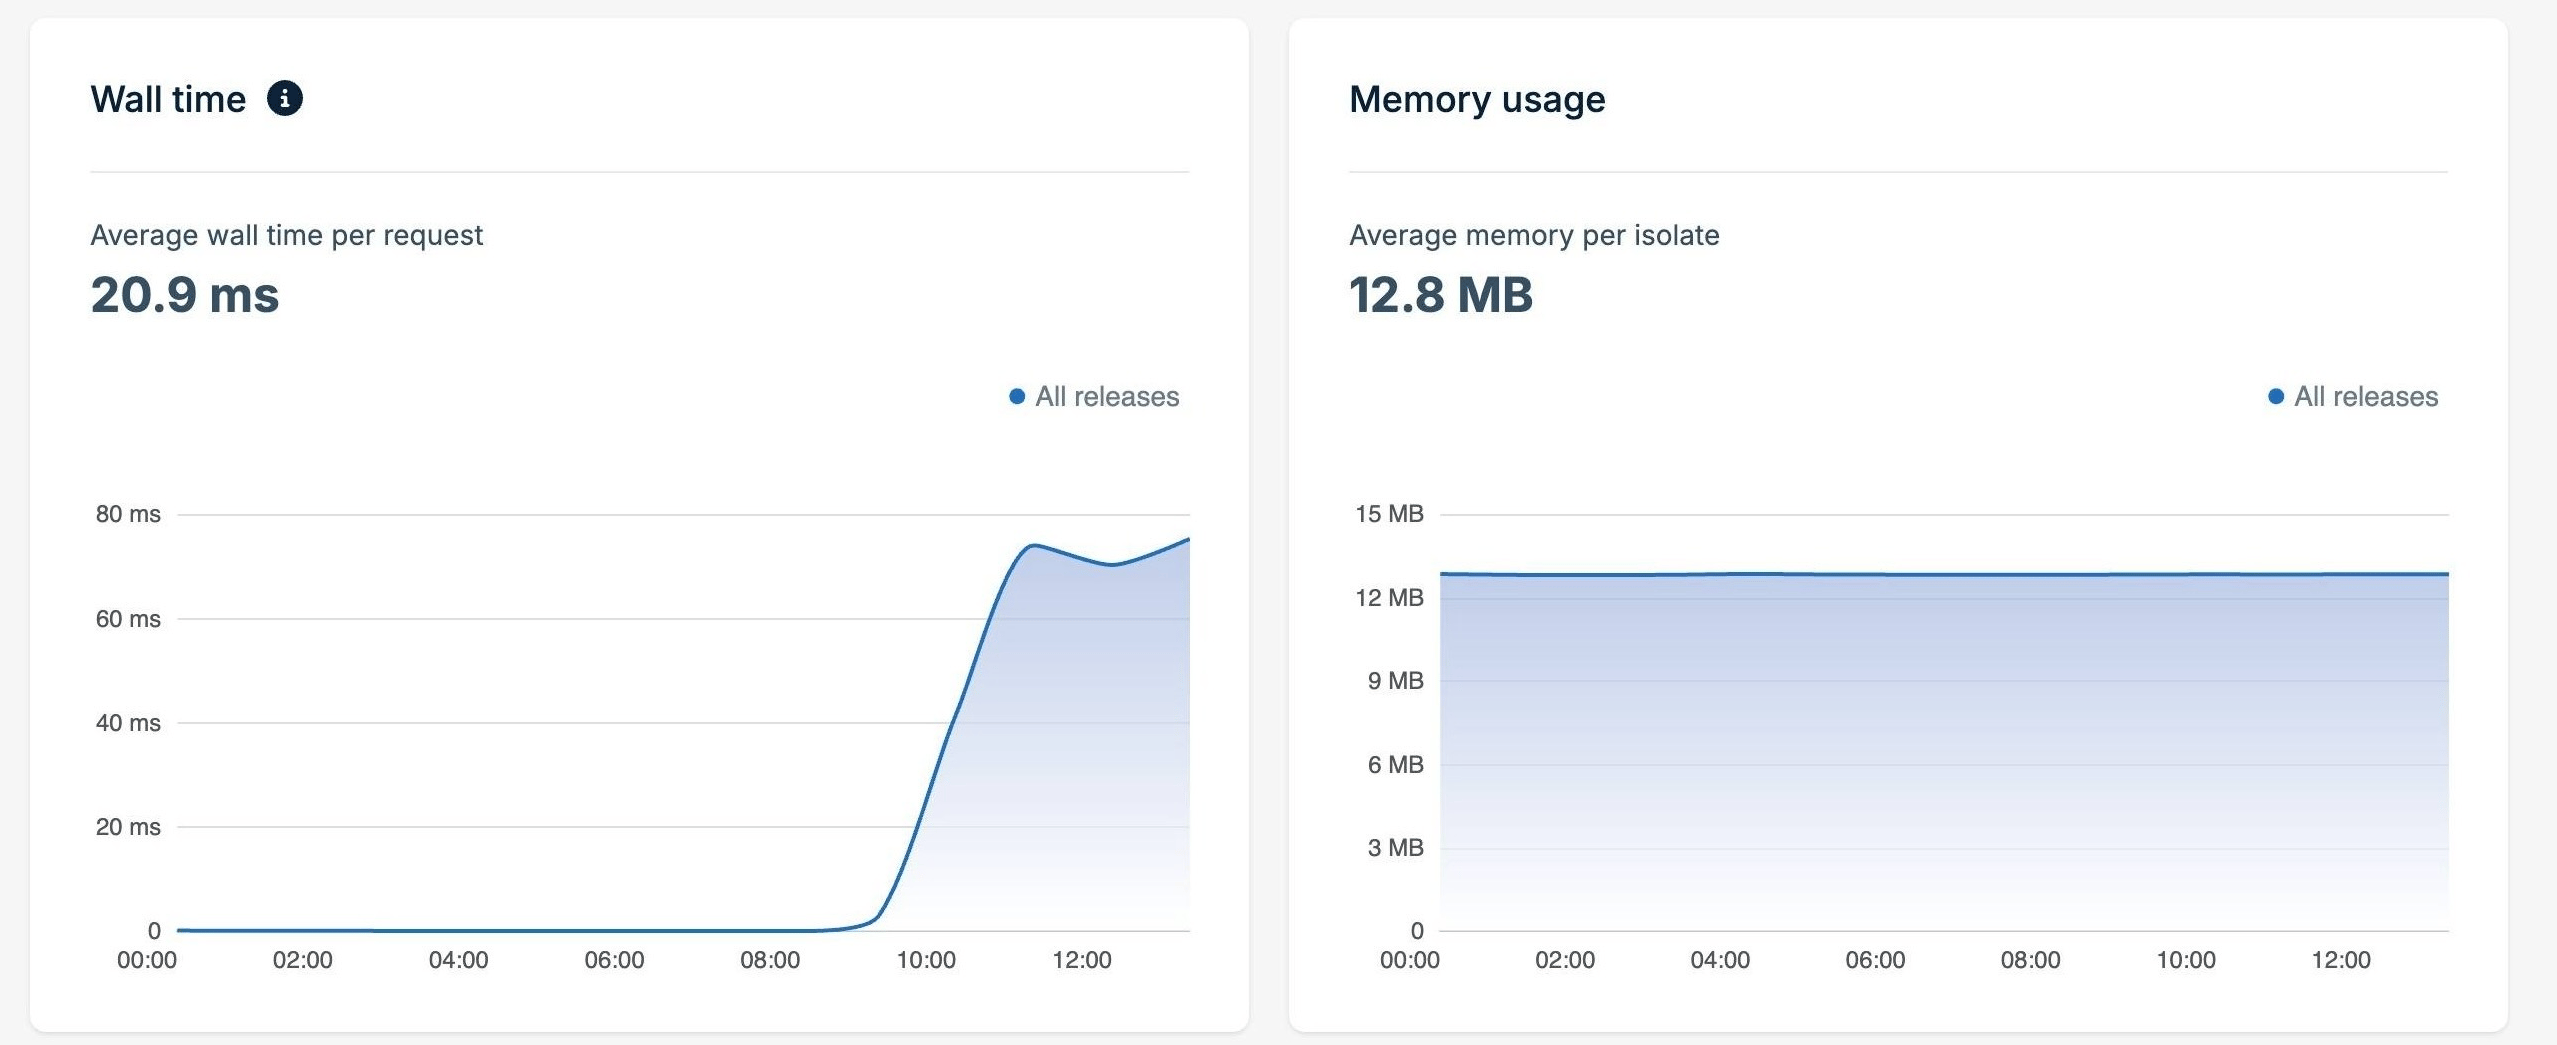
- Wall time: The average time a request takes from start to finish, including time spent waiting on subrequests and other I/O. A high wall time with a low CPU time usually means that your script is waiting on a slow origin.
- Memory usage: The average memory used by each isolate running your script. Compare this value with the memory limit.
Subrequests
The Subrequests table lists every origin your script called withfetch(). For each origin, it shows the number of requests, a breakdown by status code class (2XX, 3XX, 4XX, 5XX), and the average request duration. Use the search box to find an origin.
Use it to find the upstream service that is slow or returning errors.
Errors by request status
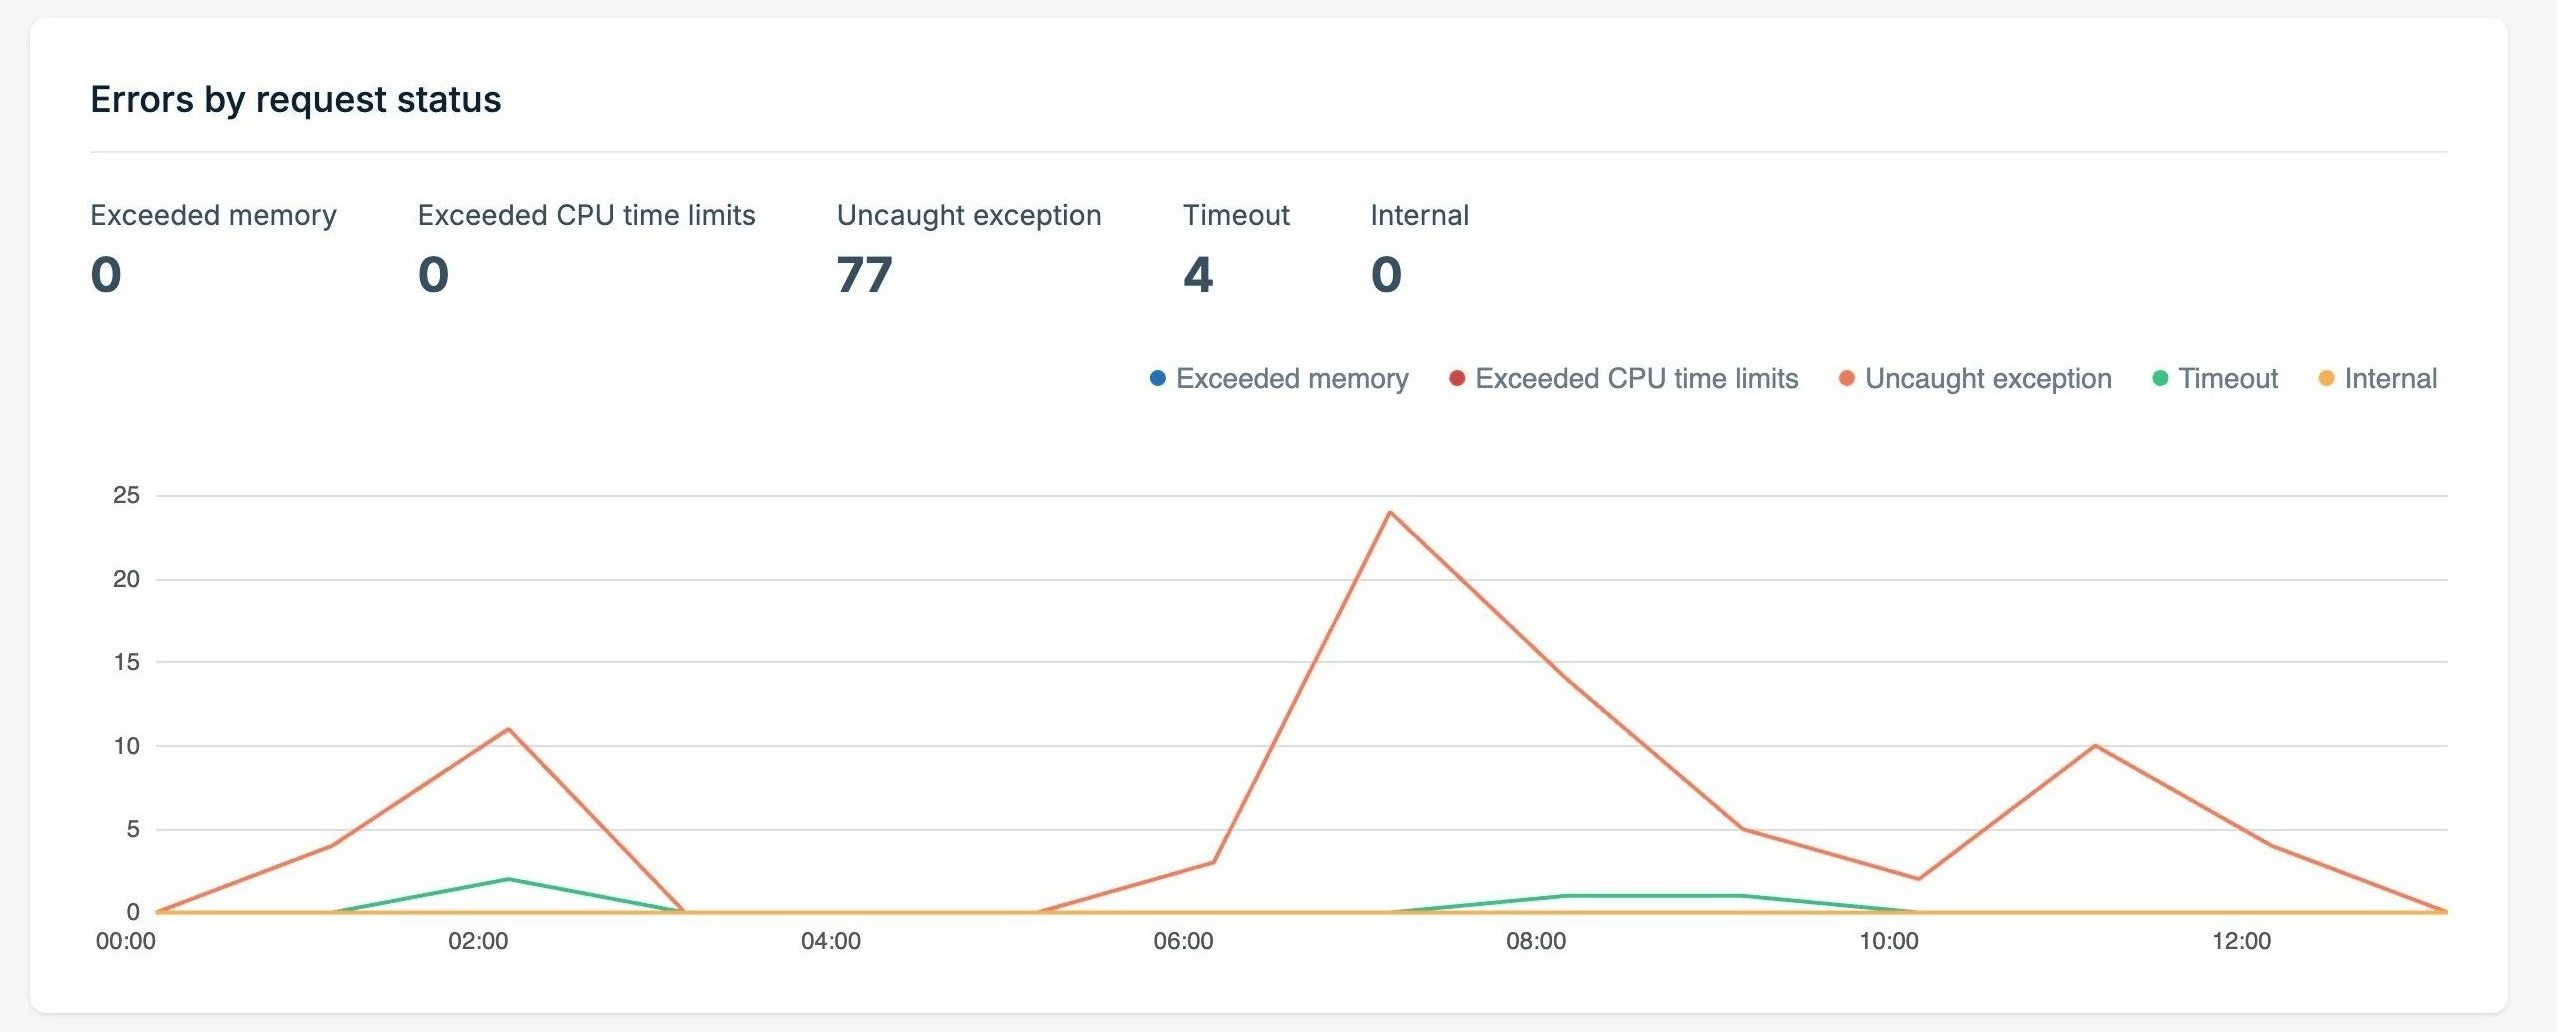
To find out what caused an uncaught exception, look at the logs for the same timeframe.
Release comparison
The Release comparison panel shows how each release performed. When more than one release served requests in the timeframe, you can compare them side by side. Use this panel after a deployment to check the new release’s CPU time, wall time, and memory against the previous release. The table shows these values for each release:- Release: The deployment ID.
- Requests: The number of requests the release served.
- CPU time: The total CPU time the release used.
- CPU time / request: The average CPU time for each request.
- Avg wall time / request: The average wall time for each request.
- Avg memory / isolate: The average memory used per isolate.
- Cold start rate: The percentage of requests that had to start a new isolate.
- Startup time: The average time to start the script on a cold start.